Amplification DDoS Attacks
Amplification DDoS attacks are one of the most prevalent forms of denial-of-service attacks. This type of reflective denial-of-service attack abuses two flaws in core networking protocols:
- IP header information is not authenticated
- UDP does not employ a handshake
The first flaw allows an attacker to spoof requests to a vulnerable service in the name of the victim, the second flaw causes the vulnerable service to answer this request immediately.
The benefit of these attacks for attackers are two-fold: Firstly, by using vulnerable services as traffic reflectors, these attacks inherently hide the attacker's address, thereby hindering prosecution. Secondly, small requests usually suffice to trigger large responses, leading to an amplification in attack bandwidth towards the victim. Depending on the protocol being abused, an amplification factor of 100x or more can be achieved, and many popular protocols can be abused for this, including DNS, NTP, SSDP and more (see here for our analysis of memcached DDoS attacks).
What makes amplification DDoS even more wide-spread is the fact that such attacks can be easily purchased online from so-called booter services. These websites often operate under the disguise of a "legitimate stress-testing service" offering "stress-testing capabilities" to network operators, but allow one to freely "stress-test" any IP address for only a small fee.
Observing Amplification Attacks
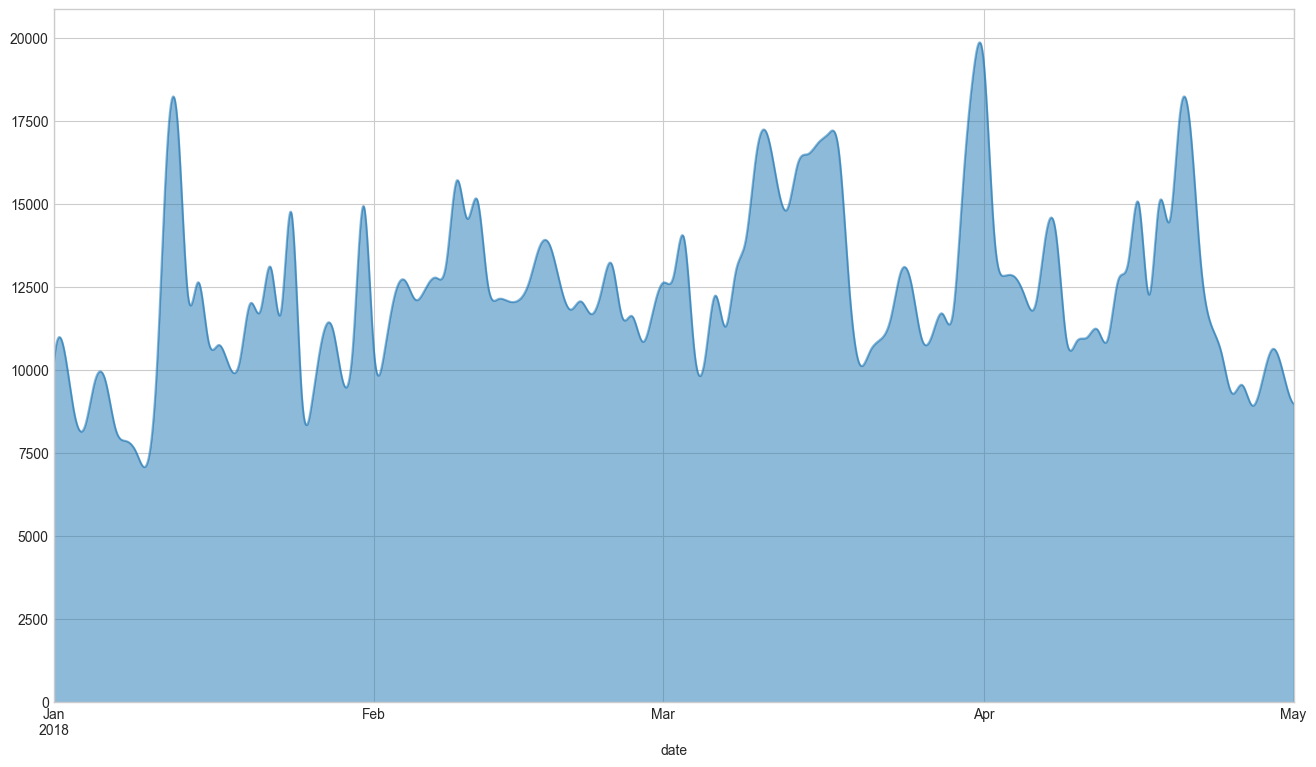
We operate a network of honeypots designed for amplification DDoS attacks. These honeypots mimic vulnerable services with the intent to be "abused" by attackers. However, instead of then relaying attack traffic towards victims, a log-message is generated instead allowing SISSDEN to observe these attacks in near real-time. In the first four months of 2018, our honeypots observed between 7,000 and 20,000 amplification attack per day, with an average of about 10,000.
Amplification Vectors
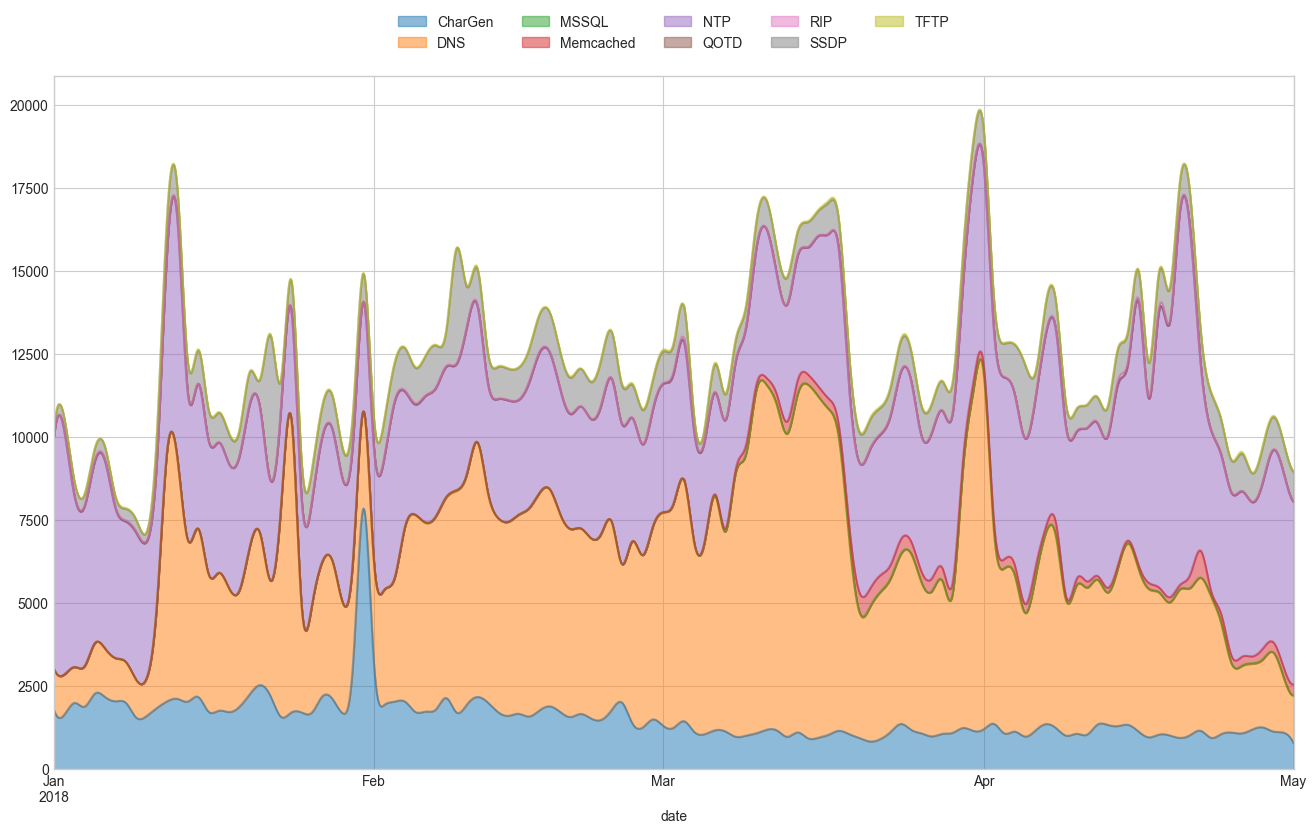
Breaking these down per protocol reveals some interesting insights. For example, the first spike in January was mainly caused by an increase in DNS-based attacks, as were the ones in mid and end of March. On the other hand, the spike end of January was caused by CharGen-based attacks, and mid April, NTP saw an increase.
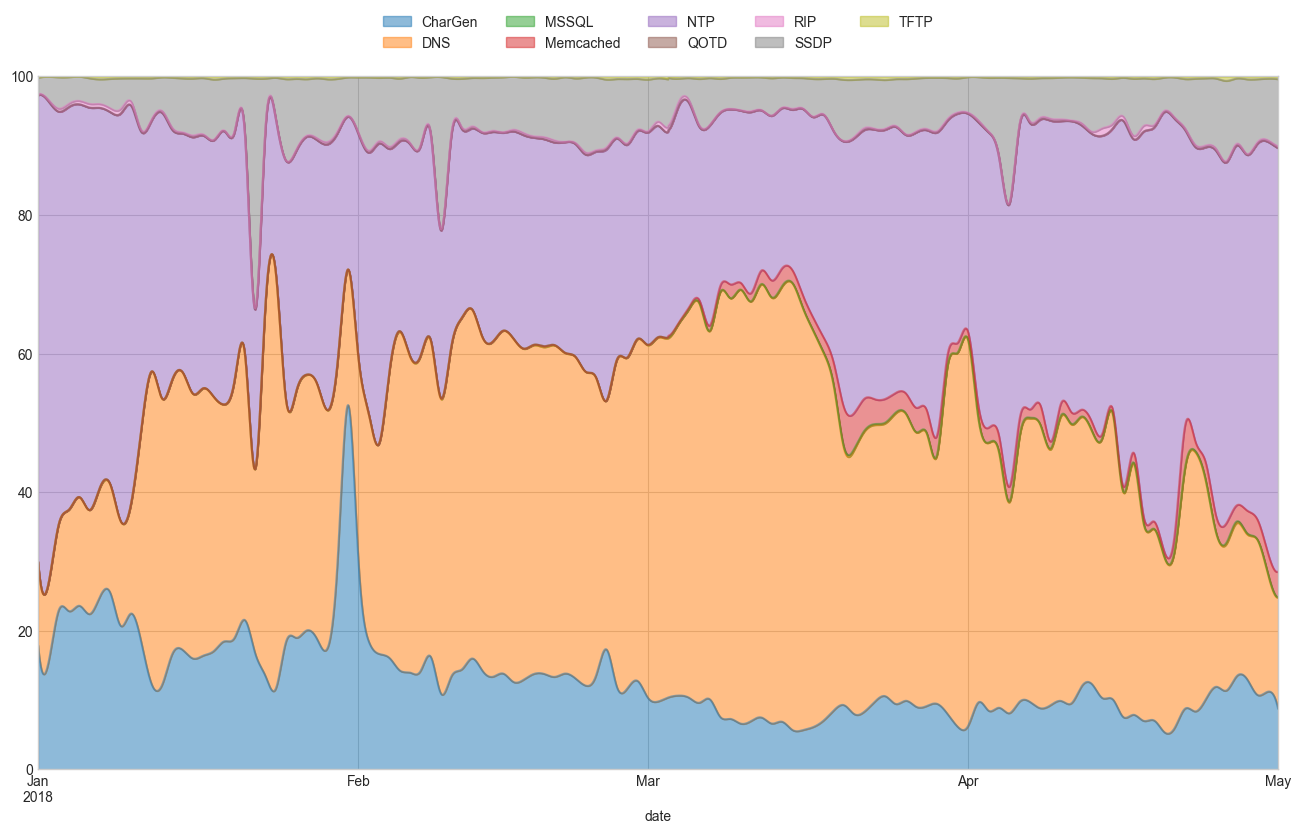
These relations can be even better seen in a normalized graph, giving relative percentages between attack protocols. As can be seen, the most prevalent attack vectors are CharGen, DNS, NTP, and SSDP. Two more interesting observations that can be drawn from this graph:
Firstly, attackers are quick to find and abuse vulnerable servers. After the amplification vulnerability in Memcached was revealed, we added support for memcached to our honeypot, with a roll-out in the first days of March. Only a few days later, Memcached can be seen to constitute a notable fraction of attacks observed by our honeypots, meaning that attackers found and added our honeypots to their list of reflectors.
Secondly, many of these attacks seem to stem from booter services. This can be seen, as there is a notable decrease in DNS-based attacks towards the end of April, which coincides very well with Europol's actions against webstresser, one of the biggest booter services to date.
Attack Durations
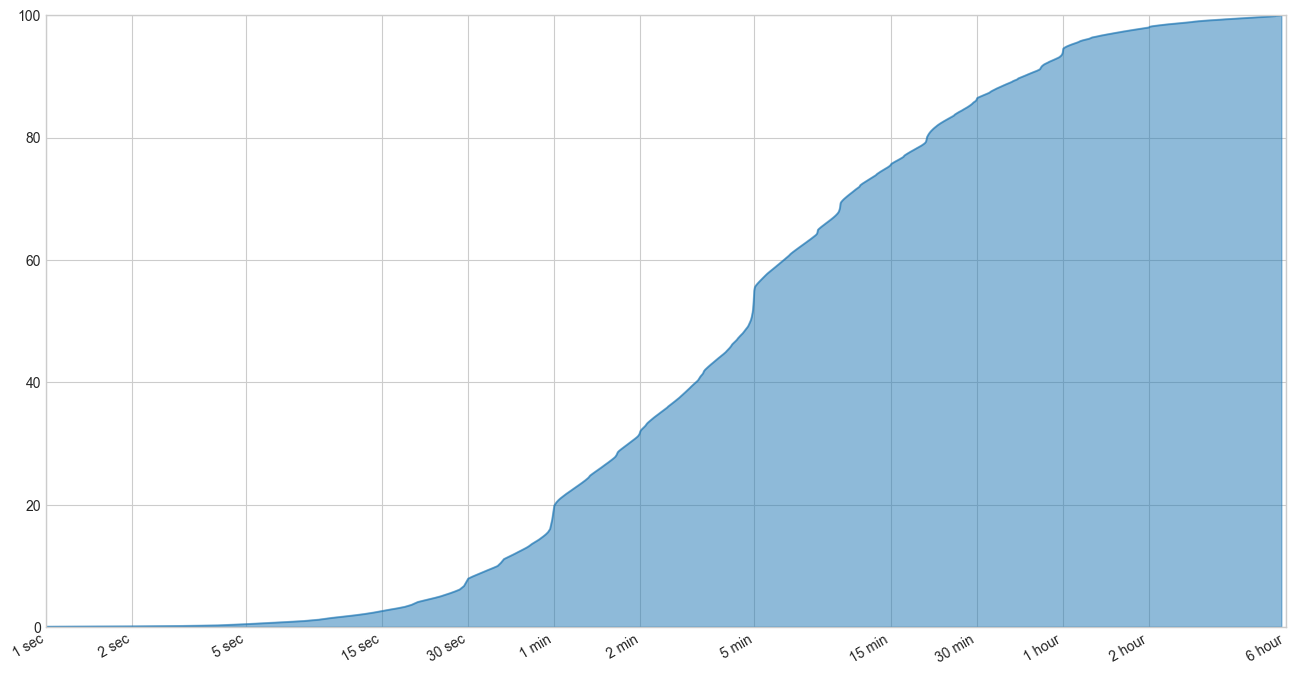
Interestingly, amplification attacks are not very long-lasting. More than 90% of attacks are shorter than one hour, and more than half lasts only five minutes. In fact, 20% of all attacks are shorter than one minute.
Looking at the durations of amplification attacks gives another indication of automated attacks, visible as almost step-wise increases around one and five minutes, respectively. As booter services often only allow to select an attack duration from a predefined list, one would expect to see these steps in the above graph. This is further confirmed by similar steps around 30 seconds, 10 minutes, 20 minutes, and one hour.
Attack Victims

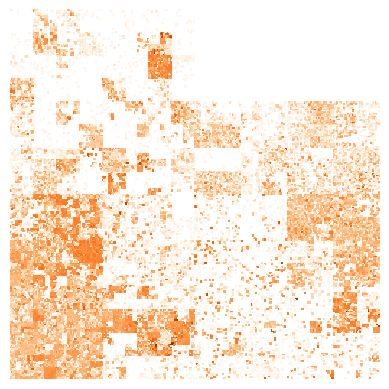


To get a better understanding of who is being hit by these attacks, one can plot all IP addresses into a 2D-plane using a space-filling curve, such as the Hilbert curve (e.g. see here). Choosing a scale such that one pixel corresponds to a /16 network, the entire IPv4 space can then be plotted on a 256x256 grid, with darker colors corresponding to a higher number of attacks in the given network.
Comparing the above graphs with the allocated ranges shows that the only non-attacked (white) areas in the graph mostly correspond to reserved or unused IP space (such as e.g. 10.0.0.0/8, 127.0.0.0/8, or 240.0.0.0/4).
Summary
Amplification attacks are one of the most prevalent threats in 2018, with over 10,000 attacks observed on a daily basis, targetting Internet participants world-wide. However, most of these attacks seem to stem from booter services, indicating that continued effort in their takedown will eventually lead to a reduction in DDoS attacks.